distributions <- c(
"beta",
"chisq",
"exp",
"gamma",
"norm",
"logis")
data <- lapply(distributions, function(distribution) {
fun <- get(paste0("r", distribution), mode = "function")
args <- c(list(1000), rep(1, length(formals(fun)) - 1))
suppressWarnings(out <- do.call(fun, args))
out
})
data <- as.data.frame(data)
colnames(data) <- distributions
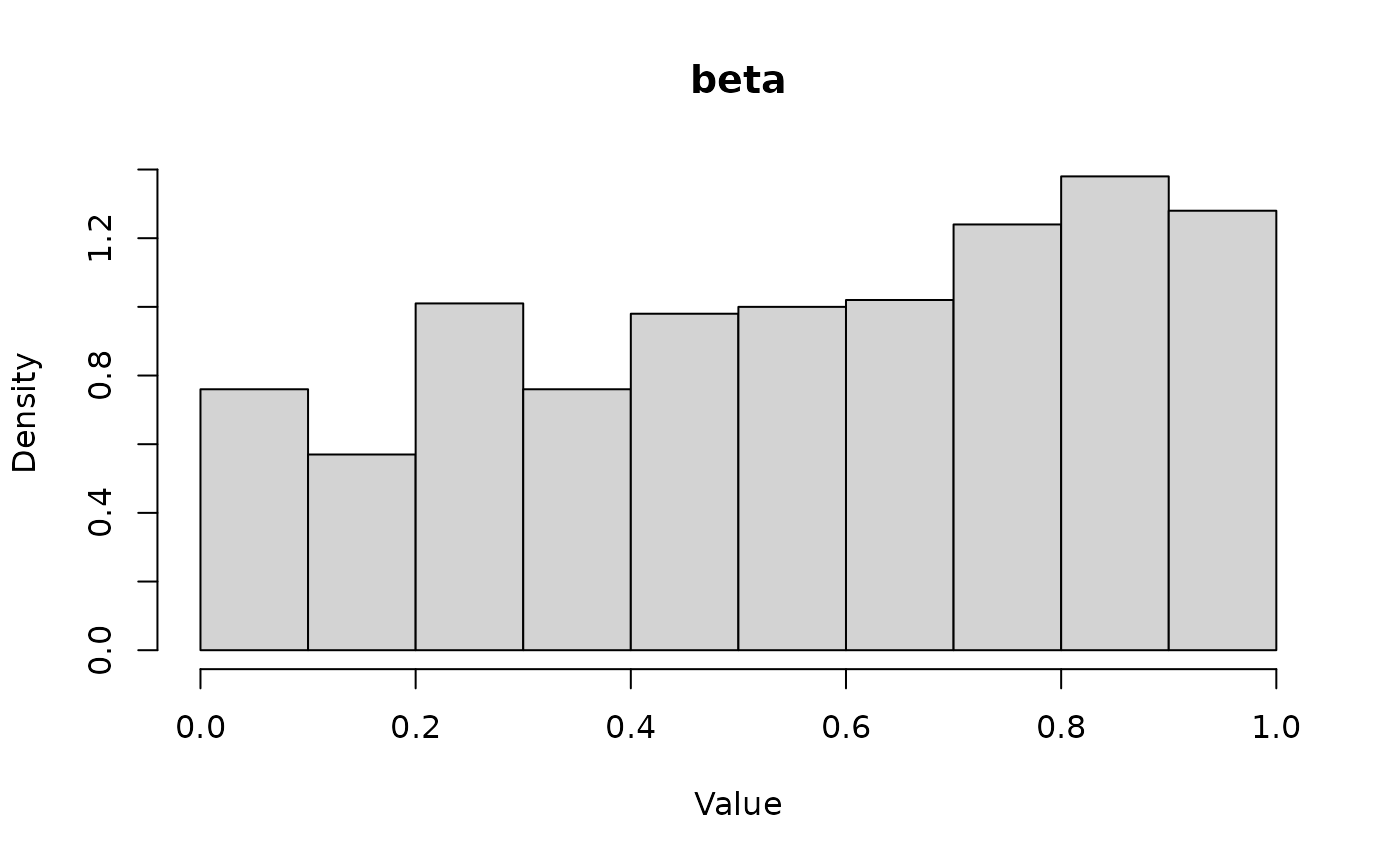
hist(data[[1]], breaks = "FD", main = "beta", xlab = "Value", freq = FALSE)
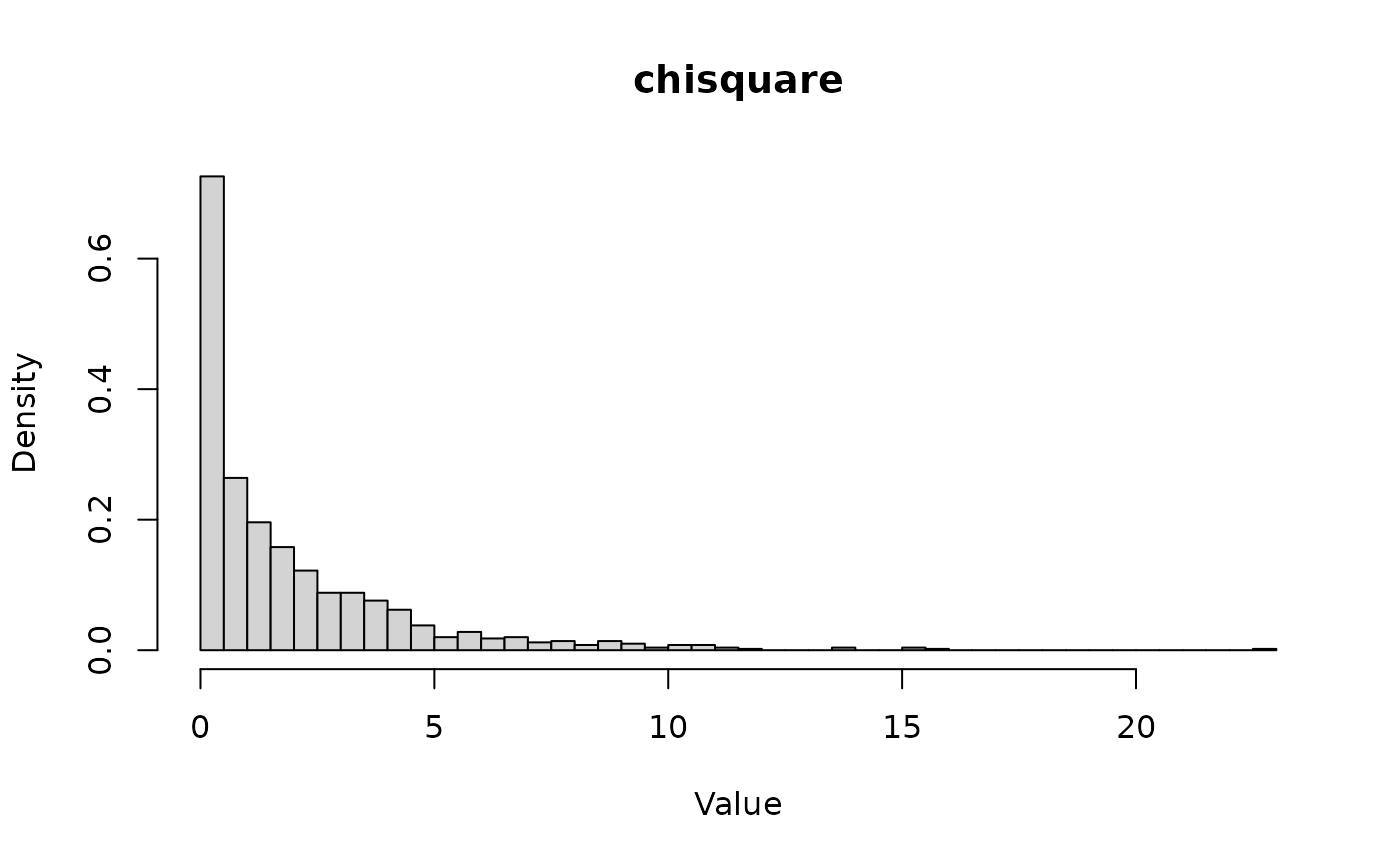
hist(data[[2]], breaks = "FD", main = "chisquare", xlab = "Value", freq = FALSE)
selectable_histogram(
    data,
    title = "Draws of 1,000 from different probability distributions",
    histnorm = "probability density")