vignettes/B_scatterplots.Rmd
B_scatterplots.Rmd
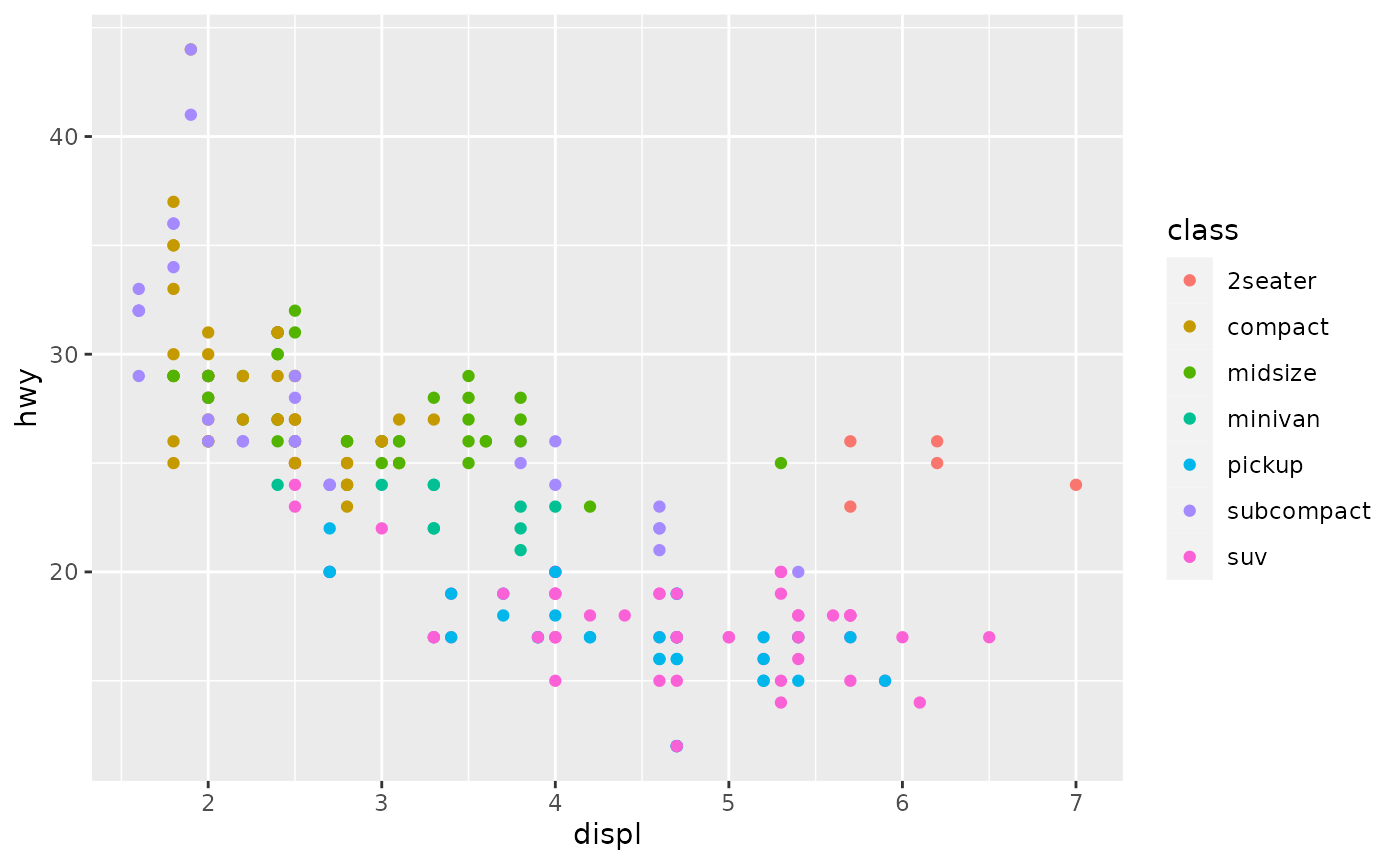
suppressPackageStartupMessages({
    library("plotlyutils")
    library("ggplot2")
    library("plotly")
})
g <- ggplot(mpg, aes(displ, hwy, colour = class)) +
    geom_point()
print(g)
ggplotly(g)
## 3D scatterplot
df <- data.frame(z = rnorm(100))
df$y <- df$z * 1.5 + rnorm(100, 1, 0.5)
df$x <- df$y * 3 + rnorm(100, 1, 5)
plot_ly(df,
    x = ~ x,
    y = ~ y,
    z = ~ z,
    type = "scatter3d",
    mode = "markers",
    marker = list(size=2))