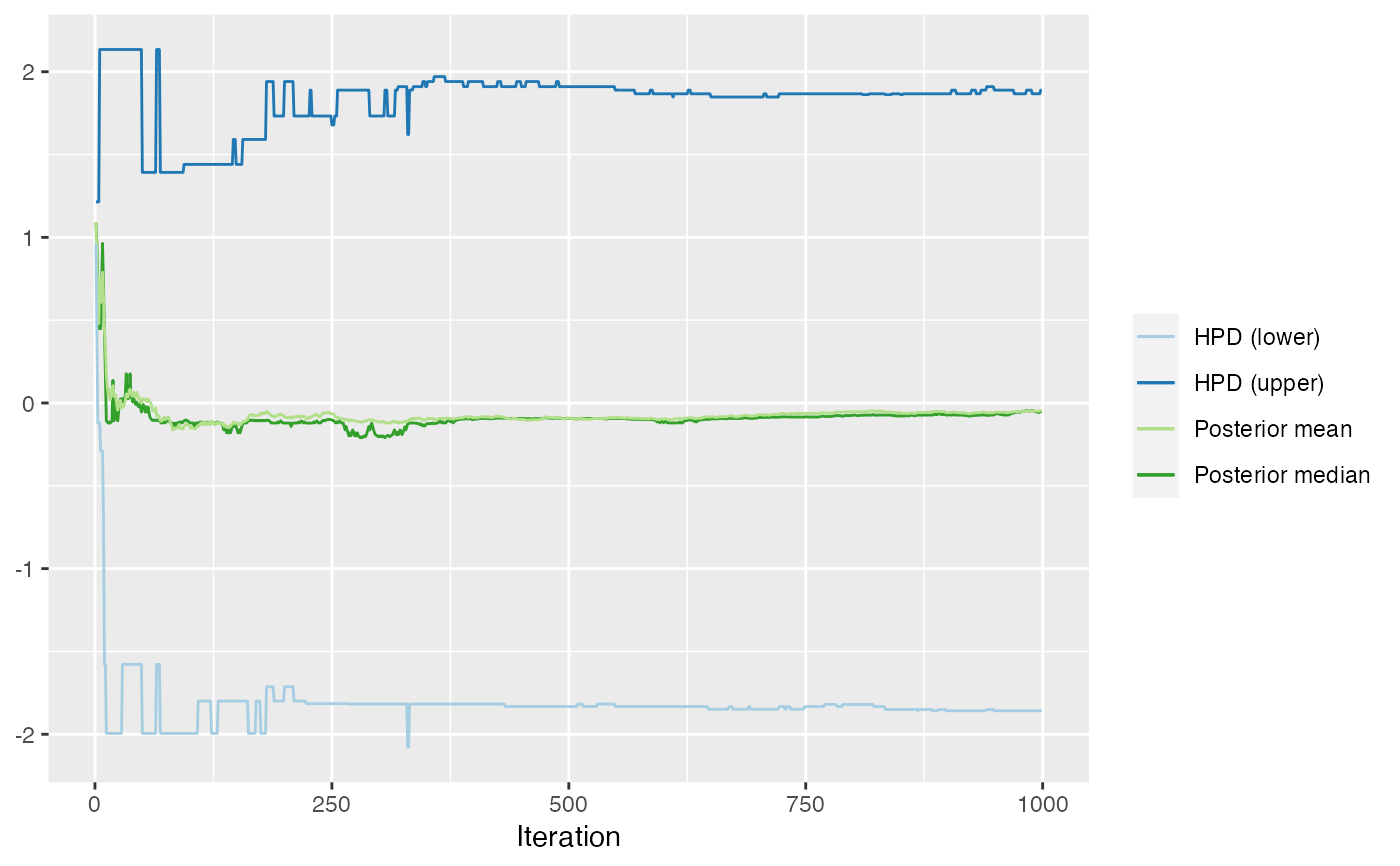
Plot the cumulative median, mean, and 95% high posterior density region.
Source:R/cumplot.R
cumplot.RdPlot the cumulative median, mean, and 95% high posterior density region.
cumplot(x, ylab = NULL, burn = 0, thin = 1, hpd_level = 0.95)Arguments
- x
An vector of MCMC draws.
- ylab
An optional y-axis label.
- burn
Integer specifying the number of initial iterations to be discarded.
- thin
Integer specifying the thinning factor to be used on the MCMC steps.
- hpd_level
Floating point specifying the desired HPD level.
Value
A ggplot showing the cumulative mean, median and HPD.
Examples
x <- rnorm(1000)
cumplot(x)